Purpose of Stadium Parable
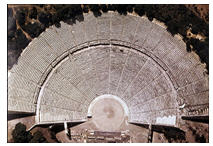
The result of building the "stadium" is an accurate model for addressing
questions that senior executives grapple with:

Does it take too long to communicate within your organization?

  • These maps identify shortest formal leadership communications paths, providing alternatives to level-by-level cascade, whisper-down-line method
Do you really understand comparative complexity of positions?
  • Network analysis provides unique metrics, based on each position’s place in whole configuration, that can be compared with budgets and performance measures
  • Offers a quick view of which positions are under greatest stress, which jobs are most complex, which most simple, and whether people are properly equipped for the real requirements of their jobs
What is the impact of a proposed reorganization, large or small?
  • Approach enables simulation of possible new designs, analysis of implications, and ability to compare alternatives
  • Serves as alternative to automatically putting organization into new configuration that often is compromise, not ideal
  • Quickly reveals how eliminating, adding, or changing jobs will impact organization
An org-chart page with 40 boxes for enterprise of 4000 shows 1% of structure
  • If 40,000 jobs in enterprise, org chart with 40 boxes = 1/10th of 1% of positions
Such views give false impressions of how things work, how rapidly they are changing. Lacking accurate representations of structure, enterprises make decisions:
  • Without input from right people
  • Set policies based on impressions/gut feelings rather than data, and
  • Put forward objectives without equipping people with resources to achieve them
Inviting Everyone

Org-chart blindness” prompts CEO to invite whole organization to stadium.

  • Purpose is to build objective, life-sized model of complete organization
  • Seat for every position, arranged in semi-circular tiers facing dais where CEO stands
  • People arrive in street clothes wearing nametags, mingle