During five years of research and development, NetAge has applied “the new science of networks" to organizations and invented tools for analyzing it. OrgScope displays the entire organization chart--whether 500 or 2000 or 10,000 or more positions--as one coherent map. Then, we interpret the results. We compare “position metrics”--how one position’s characteristics stack up against another--and answer questions like these:
-
Which jobs bear the greatest management burden?
-
Which have the largest organizations beneath them?
-
Which have their people in the greatest number of locations?
|
|
Onto the base organization chart, we layer service organizations, project teams, initiatives, leadership teams, and other professional specialty groups--and analyze those in the same way. We can model the business itself, pinpoint its hotspots, and make recommendations. |
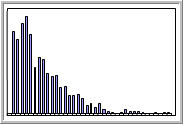 Distribution of Manager Span Distribution of Manager Span
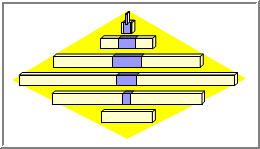 Distribution of positions by level Distribution of positions by level
-
In 2003, Eleum launched a new 5000-position regional business unit within 100,000-position global company
-
Complex company in complex, dangerous industry
-
New organizational design benefited from highly experienced and thoughtful senior executives
-
Fed data from enterprise HR system into OrgScope to create org network model
-
Each position reports to another position and is marked by its level, which indicates its “degree of separation” from CEO
-
Each position is associated with a specific organization
-
Most positions are associated with named people (though some are vacant)
-
Each position is identified with a physical location
-
OrgScope creates a complete, very large org chart, whose results can be analyzed, compared, and layered with additional data
Summary of Results
-
Business studied in pilot phase is a diamond shape, not a �traditional pyramid, 8 levels deep
-
Some very large organizations (100+) are buried quite deep in hierarchy (at levels 4-6)
-
Communication by cascade cannot reach whole organization quickly, but a “sideways” strategy can
-
Some key organizations are up to four times as large as they appear on organization chart when matrix reports and contractors are added
-
Most managers supervise small groups; a few manage very large staffs of 30 or more
-
Some positions—about 20%—are inherently more complex than others
-
These “organizational ‘hotspots” benefit from more management attention, greater HR and IT support
-
In formal leadership groups, some functions are over-represented, others underrepresented
|
