Why Hyperbolic |
“Hyperbolic trees are very valuable to visualize hierarchical structures such as file directories, web sites, classification hierarchies, organization hierarchies, newsgroup structures, etc. While traditional methods such as paging (divide data into several pages and display one page at a time), zooming, or panning show only part of the information at a certain granularity, hyperbolic trees show detail and context at once.”
|
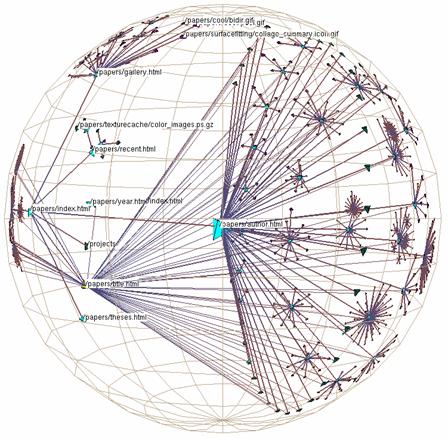
“Hyperbolic graph layout uses a context + focus technique to represent and manipulate large tree hierarchies on limited screen size. Hyperbolic trees are based on Poincare's (1854-1912) model of the (hyperbolic) non-Euclidean plane.” |
|

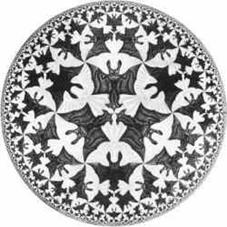
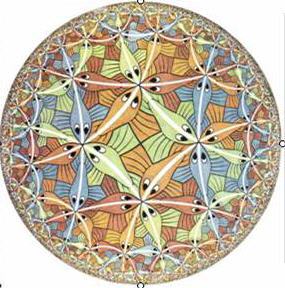
M.C. Escher (1898-1972) created original art using a non-Euclidean perspective
 |
Seminal paper on hyperbolic visualization of complex information:
|
John Lamping, Ramana Rao, and Peter Pirolli (1995) “A focus+context technique based on hyperbolic geometry for visualizing large hierarchies.” In Proceedings of the Conference on Human Factors in Computing Systems, 1995, 401-408.
Ramana Rao, the youngest member of John Seely Brown’s team at Xerox PARC, was one of the founders of Inxight (who make the OEM platform for OrgScope), and is currently advising NetAge |
“Seeing is believing”
A way to see positional ‘trees’ in the context of their organizational ‘forests.’
The OrgScope display is a hyperbolic viewer. An organization is spread on a transparent globe which the user can ‘fly’ over. Starting perhaps with a high-level view of the terrain at the organization’s “North Pole,” you begin to move and quickly see new positions coming into view, nodes becoming larger as you fly nearer. Selected, a position snaps to the center and becomes the focus of the network. From the focal point of view, the network horizon stretches out 2-4 degrees of connection in all directions (depending on window size and the “stretch” setting). A sense of ‘altitude’, or ‘depth,’ is offered by visual cues (e.g., colors, labels) of the levels traversed, as well as the curvature of the display