Post on OrgScope and recovery by John Kamensky, IBM Center for Business of Government
Endless Knots posts on recovery report:
Part 1
Part 2
Transparency and Accountability
During the week before the U.S. Congress passed the massive $787 billion stimulus bill, President Obama’s Chief of Staff sent a memo to the most senior leaders of the new administration. In it, Rahm Emanuel said that the heads of all departments and agencies—from the Secretary of Treasury to the Chair of the Federal Reserve—needed to be “preparing for implementation of the pending recovery legislation.” The week after the bill’s passage, Peter Orszag, director of the Office of Management and Budget (OMB), sent a follow-up memo to the same leaders, laying out the “initial implementing guidance for the American Recovery and Reinvestment Act.” Both memos (two pages and sixty-two pages respectively) pointed to the importance of and commitment to two core principles: transparency and accountability.
Information transparency is the metaphorical extension of optical transparency, the ability to see into and through physical materials, as if they were enclosed in glass. The initial guidance memo lays out some requirements to achieve transparency, principally that all major communications and weekly progress reports must be available on the web, in easily digestible forms. By early March, the first postings of actions and reports were available on both the main tracking site, Recovery.gov, and those of many of the agencies, each with its own unique web flavor.
The memo also specifies how to track accountability through “Formula Block Grant Allocation Data.” This is the heart of the matter, comprising the chunks of money that make up the recovery spending—grants, contracts, loans, and loan guarantees. Where transparency is the ability to see what’s going on, accountability is about what you see when you look.
The concept of accountability is embedded in a concrete logical relationship and thus can be tracked. This structure shows that there is a role of responsibility as well as accountability in the relationship. After looking closely at the data categories, it seems that responsibility is missing from the OMB model for tracking recovery spending. Filling the gap and creating more transparency on the responsible side of the funding equation enables more trust in the government, which is extremely important right now, to say the least.
Network of Accountability and Responsibility
Accountability is an ethical concept with simple network logic: “B is accountable to A,” two nodes connected by a directed link. When you connect nodes together with links, you get networks.
The Latin derivation of accountability contains the root “to calculate,” hence its ancestry in the (ac)counting professions and the manipulation of data. The behavioral derivation is from the money lending systems of ancient Greece and Rome, of lenders sending money to borrowers who were then accountable to them. Money flows from lender A to borrower B.
There are two parties to the relationship, each with different roles. The lender (A) is responsible while the borrower (B) is accountable. Often used as synonyms, “responsibility” and “accountability” represent the two endpoints of a shared relationship. We can see how important, and how different, these roles are in a mortgage relationship, a non-trivial matter in these harrowing times. Bankers are responsible for the use of their (organization’s) funds and verifying the prospective homeowner’s ability to repay, while borrowers are accountable for the funds with contractual obligations to the lender.
The two-part terminology also applies to the vertical, hierarchical form of the relationship. From the President and CEO at the top through executive and supervisory layers to non-managerial staff, in each reporting relationship there are two stances—the “from” role, which identifies the responsible leader while the “to” role identifies the accountable follower. Hierarchies are critical because they represent the real infrastructure of responsibility and accountability that hold the organization together and support all the other forms of links that enable the enterprise to operate. Org charts are responsibility charts. People in positions are responsible for those below them and accountable to people above.
Making the organization of government transparent, which is simply to hook all its org charts together from top to bottom into one digital chart, brings benefits far beyond tracking responsibility for the recovery money. Transparency of responsibility and accountability in government as a whole is the foundation for developing trust in our common enterprise. Trust, qualitative as it is, is the basic currency for both politics and the economy. It is arguably the most important factor in both long-term recovery and success in all the other areas of concern to the Obama administration—e.g., health care, energy, and education.
The two roles in the funding relationship represent two spheres of trust, the responsible government and the accountable recipients. Transparency on the recipient side, especially in the private sector, will always be difficult, and trust will be hard to grow. However, the administration has a more direct ability to increase its own transparency and responsibility, and thereby generate more trust in government itself, a very broad benefit.
Accounting and Organizational Structures
OMB carefully sets out data categories for tracking the recovery spending. While they appear to contain components that identify organizations, e.g. things are labeled “agency,” “program,” and the like, which do in fact correspond to boxes on the government’s org charts, these components actually represent parts of the accounting system. The three levels of the government’s accounting code (formally, the Treasury Accounting Symbol, or TAS)—which identifies agency, program account, and (optionally) sub-account—do not represent the real organizational hierarchy, just the budget buckets.
While this might appear to be a fine point, it is instead a crucial distinction. Accounts do not authorize—people-in-positions do. Authorization for dispensing funds comes from unique individuals who serve in specific positions embedded in an administrative hierarchy of organizational responsibility and accountability, aka the government’s org chart.
 While
the organization hierarchy and the accounting hierarchy overlap in
the agency (e.g., a cabinet department or independent agency) and in
a specific program, the organization is not the accounting
system. In fact, the program dispensing the funds may be administered
many levels away from the most senior leadership position.
While
the organization hierarchy and the accounting hierarchy overlap in
the agency (e.g., a cabinet department or independent agency) and in
a specific program, the organization is not the accounting
system. In fact, the program dispensing the funds may be administered
many levels away from the most senior leadership position.
In reality, somebody in some official position—a civil servant job—signs off on each grant. Typically, teams manage the grants. These teams have a supervisor who reports to an executive linked to the head of the agency up a chain of some number of reporting links. This is the chart of responsibilities for the recovery money.
We can see this responsibility-string through the example of a recovery program listed on Grants.gov. The “Extramural Research Facilities Improvement Program” represents $300 million in new grants to funnel through the National Center for Research Resources, which is part of the National Institutes of Health (NIH), which is part of the Department of Health and Human Services, the agency accountable to the president for the money (see Figure 1). Ultimately, the president is responsible for the actions taken by all the departments and agencies in the Executive Branch, and is accountable to Congress and its authorizing legislation. Finally, Congress is accountable to the U.S. people come election time, the beneficiaries, we hope, of the recovery funding.
While the accounting system is a highly simplified structure, the responsible official is likely to be eight or more links—“degrees of separation”—from the highest, most responsible official, the president himself. Making the leadership hierarchy transparent is a key part of developing trust in the government’s actions.
By following the recovery money down a chain of responsibility from its agency to a specific position and person, we can see each chunk of funds as it flows through the whole executive branch. By making the entire network of connections transparent, oversight and accountability become simple by-products of the funding process. People in their government jobs will be much more likely to act responsibly if the results of their work are visible to all, not just to their supervisors.
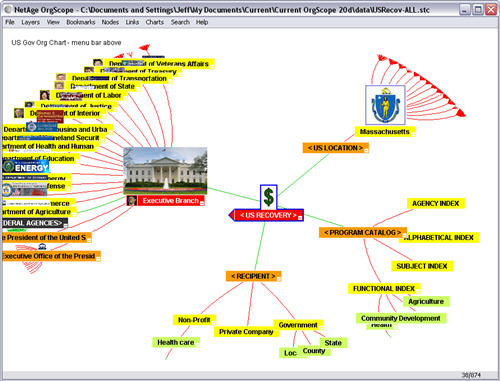
Transparent network maps, of the type we’re proposing and which we picture at the opening of this report, help everyone, both inside and outside government, gain better information and understanding of what’s happening as it’s happening. This kind of transparency allows corrections and improvements in programs before they’re too late, enabling large numbers of people to engage in the critical conversations about the economic meltdown and recovery. We need all the brains we can get in solving our common problems.
What’s in the Recovery Picture?
Accountability starts with transparency of details. What, exactly, will we know about each block of money? How will we find it, track it, and understand it?
In network lingo, the recovery data model laid out in the OMB memo specifies six nodes, including the grant node. Each node has a unique ID situated in a defined classification system, and it has a line of text that describes it, a memo field, if you will, providing a name or title. The six nodes are:
-
Grant block, a chunk of money with its record ID;
- Responsible agency, with a Treasury Account Symbol (TAS) code;
- Program vehicle, identified by a code in the Catalog of Federal Domestic Assistance (CFDA) which provides a wealth of purpose-related categories to sort grants by;
- Agency account, the extension of Treasury’s TAS code;
- Recipient of the funds, identified by a Dun & Bradstreet number (DUNS), which, like the program’s CFDA code, provides entry to an array of associated details and purpose-related classification systems (e.g., sector, industry); and
- Place, the physical location of the recipient, completely defined in the data model by an address with a zip code and a city, county, and state Federal Information Processing Standard (FIPS) code, which enable easy association with political districts benefiting from the funds.
The
grant block record laid out in the initial guidance (see Figure 2)
means, for example, we can follow a grant to a zip code, which puts
this chunk of money in the context of a nested set of legal and
political jurisdictions capped by states. Simultaneously, the same
record can be represented in a variety of other classification
systems, such as one organized by purpose (CFDA, the Catalog of
Federal Domestic Assistance) or by a chart of accounts (TAS).
Links between nodes are either contained in the data record for each grant block (e.g., all the levels of address are specified) or are implied by an external classification system (e.g., the program code is part of the CFDA and nestled in tree structures there).
What’s Missing? Responsibility
The OMB model for “following the money” is missing the organization itself, the codes that place the grant within a chart of responsibilities.
There are two pieces of data missing.
-
First is the position responsible for each grant; and
- Second, where appropriate, the name of the person serving in the authorizing position.
Thus, for completeness and transparency on the input side—not just the output side–two more fields (with both a unique ID and a name/title) need adding to the recovery data model (see Figure 3).
Making
the Recovery Map
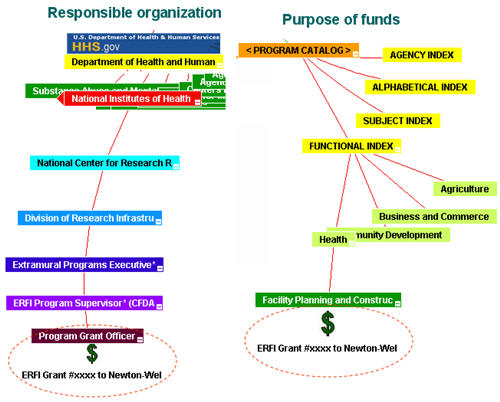
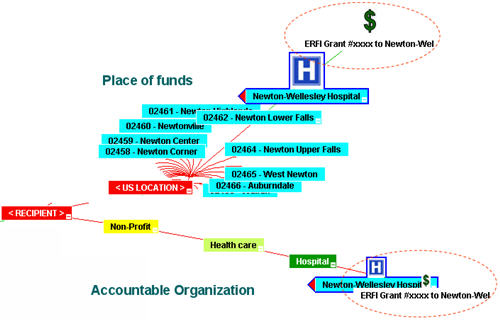
The network logic of responsibility-accountability—a directed link between two nodes—provides a simple way to connect the key elements associated with each chunk of money. To illustrate, we connected four trees into a prototype network map of the recovery spending, including the missing organizational hierarchy. Each chunk, each block grant, shows up in four ways: by granting organization, recipient of the grant, the program and purpose for which it is used, and the recipient location.
As recovery dollars flow, so will the data stream start, and the mapping will be easiest. We have created an OrgScope model to demonstrate what a cross-linked network model might look like using an actual grant program by the NIH for external research facilities and an illustrative grant to a hospital in our city of Newton, MA (see org chart strip in Figure 1).
-
For the organizational side, we used our network map of the top levels of the US Government (click to see this map live). To the existing org chart, which included NIH, we added the string of positions ending in a specific (dummy) grant block to Newton-Wellesley Hospital;
- Program category and type is modeled with a simplified outline of the Catalog of Federal Domestic Assistance (see CFDA.gov);
- Recipient type is illustrated through general categories of sector and industry; and
- Place is represented by a location map of Massachusetts organized by county (Middlesex), city (Newton), and zip code (02462, Newton Lower Falls).
Relationship chains relating a grant to the four major spokes of the recovery-spending wheel can be seen in the Figure 4 overview and the strings of connection shown in Figure 5. Of these, three have well-established classification systems (zips, DUNS numbers, CFDA). For the fourth, the government chart of responsibility for the funds, our digital org chart is a start to locating the program within the government structure. However, the government’s map of itself could and should extend to reach at least the program, if not the program officer levels.
It would not be too difficult to create an open government network map. At the top of departments and agencies, a few thousand positions in total are detailed in org charts that can be easily connected together, as we have shown in our publically available OrgScope map. For the two million or so civil service jobs, much of the information needed to assemble them almost automatically into org charts is just sitting there in federal financial systems. OMB may have much of it. The rest is in the many government human resource and information technology systems. Hooking the whole thing together is mostly a one-time expense of time and IT resources, and a process can easily be set up to refresh the basic data.
Transparency of organizational structure enables people both inside and outside the government to understand better the bureaucratic whole. By connecting the many bits of information into a coherent, shareable picture of our common government, we develop trust, hold one another accountable, and think through solutions with many minds.
Figure 5: Illustrative Grant in Four Interrelated Contexts